
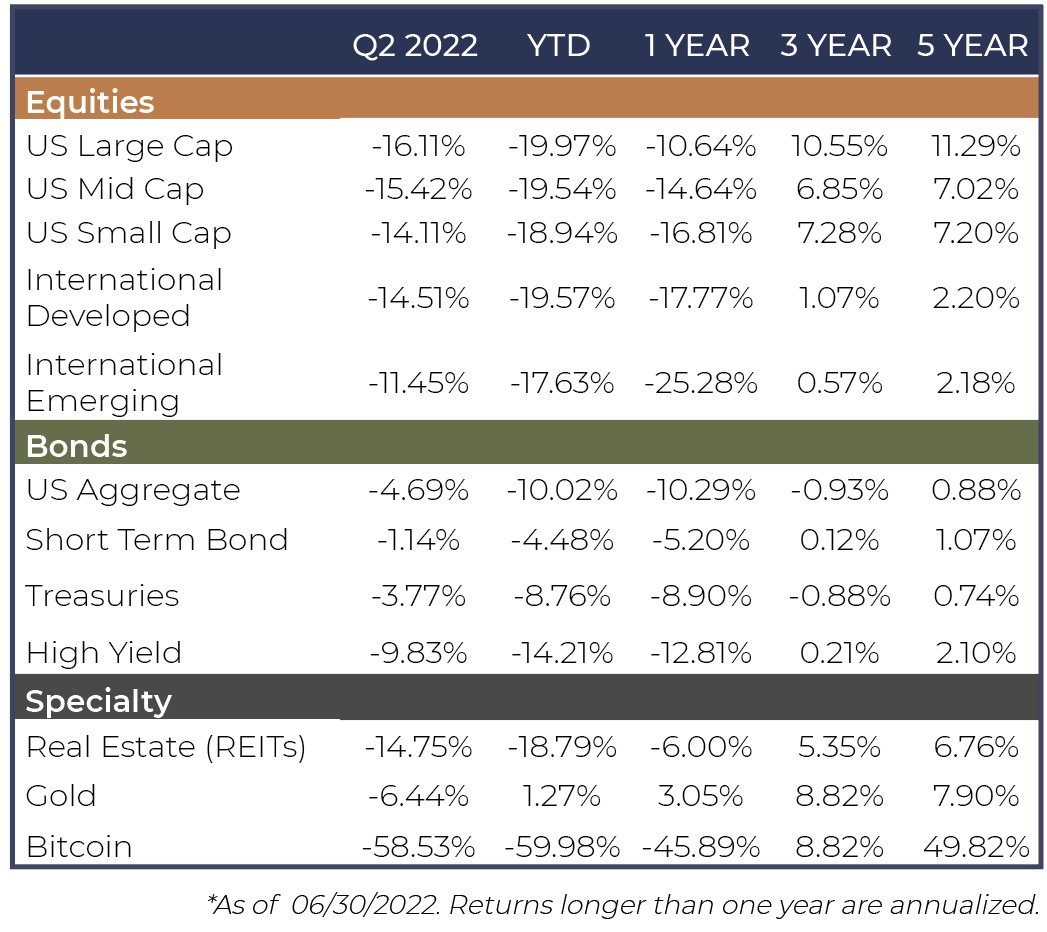
All major asset classes posted double digit declines for the first half of 2022 with the S&P 500 Index falling 20.0% and the Bloomberg Aggregate Bond Index falling 10.4%
First half decline in equity prices is one of the worst on record and the worst decline since the early 1970’s with more speculative, cyclical assets declining the most
Valuations have dropped to pre-pandemic levels indicating much of the froth in valuations has largely been correc
The S&P 500 Index declined 16.1% for the quarter bringing its year-to-date losses to 20.0%. The technology heavy Nasdaq Composite Index fell 22.3% for the quarter and 29.2% for the year. Small cap stocks, reflected by the Russell 2000, were down 17.2% for the quarter and 23.4% for the year. With the surge in oil prices driven by the ongoing conflict in Ukraine, it is no surprise that the Energy sector was the best performing segment of the market, while other less economically sensitive sectors such as Utilities, Consumer Staples, and Healthcare also outperformed. The faster growing, more speculative and more cyclical sectors such as Communication Services, Consumer Discretionary, and Technology declined the most.
The stock market sell off reflected a significant adjustment to valuation levels, reflected by the price-to-earnings ratio (“P/E”) of the S&P 500. The index started the year with a P/E ratio of 22x estimated earnings and have now declined to 16.7x at mid-year, slightly below the 10 year median and more in-line with levels seen pre-covid. While this could reflect that much of the necessary correction in stock prices has already occurred, it is important to keep in mind that corporate earnings may need to be revised downward, as the potential for an economic slowdown or recession has increased.
Seemingly persistent inflation forced the Federal Reserve to accelerate their rate hikes in June, driving bond yields higher on both the short and longer end of the curve which has led to an unusual and significant decline in bond prices. More recently, economic conditions seem to be deteriorating, as the increase in interest rates appears to be having the desired effect of cooling off the previously over-heated economy. Recently released manufacturing and new orders data demonstrated a continued and precipitous slowdown in economic activity. At the same time, inventories are increasing, which is an indicator that future growth will continue to slow.
Commodity and real asset prices increased across the board as investors flock towards historically inflation resistant assets. Oil continued its rise reaching north of $120 per barrel before receding somewhat towards the end of the quarter. Alternative risk assets such as crypto currencies, which experienced a bubble-like valuation levels 6 to 9 months ago are finally deflating in the face of rising interest rates.
Fed Chairman Powell has been clear that his top objective is to cool inflation, even if it tips the economy into a recession. We have already begun to see the initial indications of the desired effect of the restrictive Fed policy, as both commodity and energy prices peaked in early June. Furthermore, the Purchasing Managers Index (PMI), historically an important signal of economic expansions and contractions, is pointing downward, which has previously been an indicator of downward revisions to corporate earnings.
That said, there are some silver linings to counter the negative outlook. Inventory levels are returning to normal across many industries which will help counter rising inflation as supply increases to meet demand. On the whole, US household balance sheets remain healthy indicating that if energy and inflation expectations fall, demand may be swift to return. Should we see a continuation of these early signs of moderating inflation and economic weakness, we would expect a stabilization in bond prices and potentially a reversal as the Federal Reserve will have less pressure to continue to raise interest rates.
With the likelihood of an economic slowdown or recession increasing, it is tempting to let the fear drive investment decisions. However, economic data are lagging indicators while market returns are forward looking. The average peak to trough decline in the S&P 500 around a recession has been 29% across the last 12 recessions since the end of World War II. Given that the equity market has already tumbled 20% this year, could be an indicator that we are closer to the bottom than to the top.
We continue to advocate for taking a long-term investment mindset, rooted in making efficient use of each invested dollar and ensuring proper risk management across any portfolio.
Investment Advisory services are provided through Bison Wealth, LLC located at 1201 Peachtree St. Ste 1950 Atlanta, GA 30361. Securities are offered through Metric Financial, Inc. located at 725 Ponce de Leon Ave. NE Atlanta, GA 30306, member FINRA and SIPC. Bison Wealth is not affiliated with Metric Financial, Inc., More information about the firm and its fees can be found in its Form ADV Part 2, which is available upon request by calling 404-841-2224. Bison Wealth is an independent investment adviser registered under the Investment Advisers Act of 1940, as amended. Registration does not imply a certain level of skill or training.
The statements contained herein are based upon the opinions of Bison Wealth, LLC (Bison) and the data available at the time of publication and are subject to change at any time without notice. This communication does not constitute investment advice and is for informational purposes only, is not intended to meet the objectives or suitability requirements of any specific individual or account, and does not provide a guarantee that the investment objective of any model will be met. An investor should assess his/her own investment needs based on his/her own financial circumstances and investment objectives. Neither the information nor any opinions expressed herein should be construed as a solicitation or a recommendation by Bison or its affiliates to buy or sell any securities or investments or hire any specific manager. Bison prepared this Update utilizing information from a variety of sources that it believes to be reliable. It is important to remember that there are risks inherent in any investment and that there is no assurance that any investment, asset class, style or index will provide positive performance over time. Diversification and strategic asset allocation do not guarantee a profit or protect against a loss in a declining markets. Past performance is not a guarantee of future results. All investments are subject to risk, including the loss of principal.
Index definitions: “U.S. Large Cap” represented by the S&P 500 Index. “U.S. Small Cap” represented by the S&P 600 Index. “International” represented by the MSCI Europe, Australasia, Far East (EAFE) Net Return Index. “Emerging” represented by the MSCI Emerging Markets Net Return Index. “U.S. Aggregate” represented by the Bloomberg U.S. Aggregate Bond Index. “Treasuries” represented by the Bloomberg U.S. Treasury Bond Index. “Short Term Bond” represented by the Bloomberg 1-5 year gov/credit Index. “U.S. High Yield” represented by the Bloomberg U.S. Corporate High Yield Index. “Real Estate” represented by the Dow Jones REIT Index. “Gold” represented by the LBMA Gold Price Index. “Bitcoin” represented by the Bitcoin Galaxy Index
3550 Lenox Rd NE
Suite 2550
Atlanta, Georgia 30326
Investment Advisory services are provided through Bison Wealth, LLC located at 3550 Lenox Road NE Suite 2550 Atlanta, GA 30326. Securities are offered through Metric Financial, LLC. located at 725 Ponce de Leon Ave. NE Atlanta, GA 30306, member FINRA/SIPC. Bison Wealth is not affiliated with Metric Financial, LLC. Bison Wealth is an independent investment adviser registered under the Investment Advisers Act of 1940, as amended. Registration does not imply a certain level of skill or training. Check the background of this investment professional on FINRA’s BrokerCheck. Bison Wealth, LLC does not offer tax or legal advice.
Investment adviser representatives affiliated with Metric Financial, LLC, a FINRA member broker-dealer, will earn commissions on certain investments. This presents a conflict of interest because the representative is incentivized to earn a commission. This conflict is mitigated, however, because you are not required to engage the IAR or Metric Financial, LLC to invest in securities. To the extent your IAR is affiliated with a broker-dealer, you may request copies of the Form CRS associated with the broker-dealer to better understand fees and services and how those fees and services differ from those provided by Bison Wealth, LLC. Any fees and/or commissions billed by Metric Financial, LLC are distinct from and in addition to fees billed by Bison Wealth, LLC.
Bison Wealth Form CRS | Form ADV Part 2 | Privacy Policy | Accessibility Statement