
The strong stock market recovery we witnessed from the October 2022 lows came to an end on February 2nd, but not after lifting the S&P 500 17% during that timeframe. All the while, the trend of the underlying data with respect to the economy, corporate earnings, inflation, and Fed Policy has not really changed:
Sounds familiar, right? These are pretty much the same bullet points we have been discussing over the last several months. Yet, somewhat abruptly, February brought about a new tone to the market with all major asset classes declining.
A common storyline for the stock market rallies we have seen over the last several months has been that the Fed would “pivot” or cease raising interest rates for a variety of reasons. The primary theme has centered on one of two scenarios: either inflation would come down faster than expected or the economy would fall into a deep recession that would make it necessary for the Fed to “pivot” from tight to easy monetary policy. Thus far, neither of these scenarios has come to pass, as the underlying data noted above has not cooperated with this storyline. As a result, every rally that was built on the hope of a Fed “pivot” has failed when new data emerges that reaffirms inflation will remain stronger for longer and the Fed will maintain its intended course of higher rates for longer. With this backdrop, the following is a summary of our key observations over the past month and the impact on our outlook:
Inflation Update
Inflation re-accelerated modestly in January as the core price index, the Fed’s preferred gauge to measure inflation, rose to 4.7%, higher than the 4.6% in December and higher than market expectations. While goods inflation is subsiding, notably, services inflation accelerated to its fastest pace since May 1984. Services inflation tends to be stickier and driven more by labor market slack than goods inflation. Since the labor market remains tight and wage growth is still strong, the Fed’s pursuit of its 2.0% inflation target implies more rate hikes ahead and higher rates for longer than markets were pricing in during January.
Is the Consumer Strong?
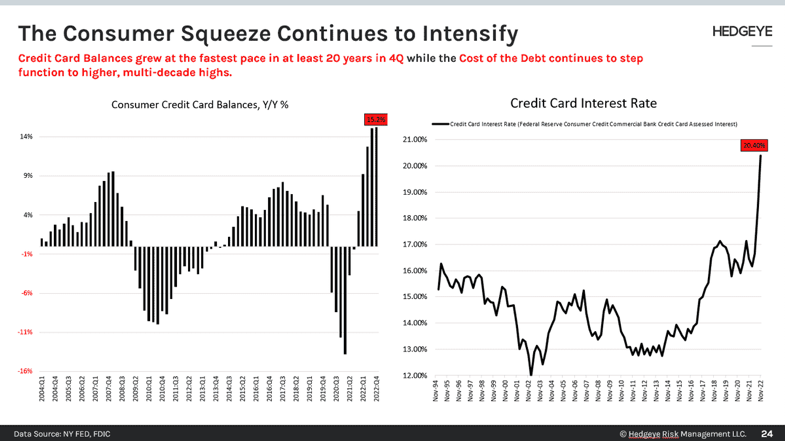
Interestingly, we have seen a recent increase in consumer spending in conjunction with the improvement in consumer sentiment data. However, if we look at the source of that spending, it is NOT coming from savings or real wages, which are being eroded by inflation. Rather, a large source of the spending is coming from increased credit usage. Credit balances have been ballooning over the last 4 quarters, while the interest rates consumers are paying on that debt has been spiking as well. With declining real wage growth and the ramp in consumer credit, we would argue that the underlying strength of the consumer is not quite as it might seem on the surface.
Housing
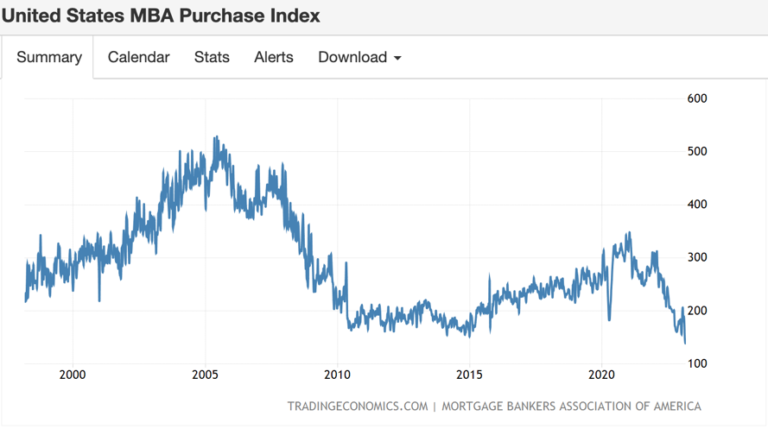
Existing home prices continued to decline in December, as high mortgage rates remained a drag on housing affordability and demand. The S&P CoreLogic Case-Shiller National Home Price Index fell 0.3%, down for the sixth consecutive month. Investors have been hoping for some housing price disinflation, as this has been one of the stickier inflation components on which the Fed is focused. Mortgage Purchase Applications were down 5.7% in last week of February marking the 3rd consecutive weekly decline and pushing the Mortgage Bankers Association purchase application index down close to 28-year lows.
It is interesting how these factors are so inter-connected. Inflated home prices affect the affordability of housing and pushes the Fed to keep rates higher. Both factors negatively impact the ability of the consumer to purchase a new home, leading to a decline in demand and new purchase applications.
Short Term Bond Yields
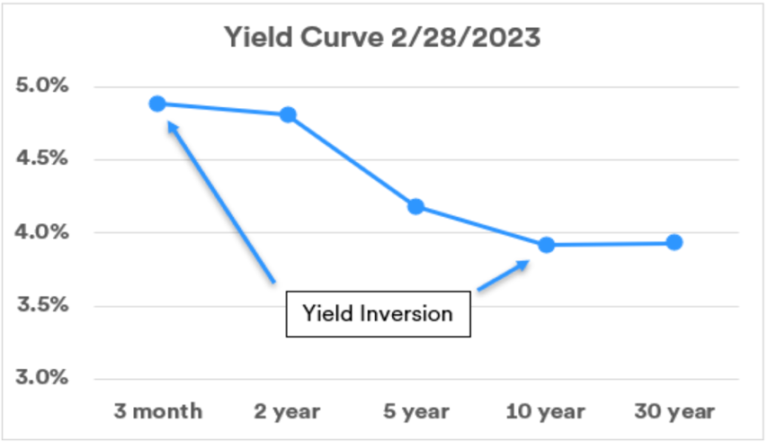
The 2-year Treasury yield rose from 4.20% to 4.82% during the month of February. The 2-year yield is highly correlated to the Fed Funds rate, almost serving as a guidepost for future Fed Funds policy direction. The rise in February occurred because of the sticky inflation and labor market data that led investors to conclude that the Fed would continue with its tightening policy. With the rise in 2-year yields, the yield curve has become even more inverted, meaning 2 year bonds are yielding more than 10-year bonds (4.82% versus 3.92). While an inverted yield curve is often seen as a sign of an economic recession, it is at odds with the tight labor market which indicates economic resilience.
The Bottom Line
As a result of the inflation and labor market data over the past few weeks in February, yields have moved higher, and the Fed has become incrementally more hawkish. Market participants are less convinced of a Fed “pivot” and are adjusting to the likelihood of higher rates through 2023. The housing market is like a real-time mechanism for measuring the expectations and impact of these rate hikes, as we have seen with the recent mortgage application data. As the impact of the Fed’s tight monetary policy feeds into the economy, we should continue to see more housing demand weakness and a loosening of the labor markets, which should result in a moderation of shelter and wage inflation.
We continue to expect that the ride will remain bumpy over the coming months, as the financial markets digest the impact of the rate hikes on the economy and inflation. Given the significant rebound in equity prices that we experienced from the October lows, a bit of a pullback and market consolidation should not be unexpected. We would also expect the Fed to acknowledge the economic slowdown as the year progresses, resulting in a more stable monetary policy. This should reduce interest-rate volatility and asset price volatility as we head toward the back half of 2023. As a result, we continue to maintain a conservative posture towards equities in our portfolios and will evaluate the relevant data as the year progresses to determine when to become more constructive on equities. Patience and discipline are keys to success in this type of environment. From experience, we know that slow and steady wins the race. As such, investing for the long-term is a marathon, not a sprint.
Investment Advisory services are provided through Bison Wealth, LLC located at 3550 Lenox Road NE Suite 2550 Atlanta, GA 30326. Securities are offered through Metric Financial, LLC. located at 725 Ponce de Leon Ave. NE Atlanta, GA 30306, member FINRA and SIPC. Bison Wealth is not affiliated with Metric Financial, LLC., More information about the firm and its fees can be found in its Form ADV Part 2, which is available upon request by calling 404-841-2224. Bison Wealth is an independent investment adviser registered under the Investment Advisers Act of 1940, as amended. Registration does not imply a certain level of skill or training.
The statements contained herein are based upon the opinions of Bison Wealth, LLC (Bison) and the data available at the time of publication and are subject to change at any time without notice. This communication does not constitute investment advice and is for informational purposes only, is not intended to meet the objectives or suitability requirements of any specific individual or account, and does not provide a guarantee that the investment objective of any model will be met. An investor should assess his/ her own investment needs based on his/her own financial circumstances and investment objectives. Neither the information nor any opinions expressed herein should be construed as a solicitation or a recommendation by Bison or its affiliates to buy or sell any securities or investments or hire any specific manager. Bison prepared this Update utilizing information from a variety of sources that it believes to be reliable. It is important to remember that there are risks inherent in any investment and that there is no assurance that any investment, asset class, style or index will provide positive performance over time. Diversification and strategic asset allocation do not guarantee a profit or protect against a loss in a declining markets. Past performance is not a guarantee of future results. All investments are subject to risk, including the loss of principal.
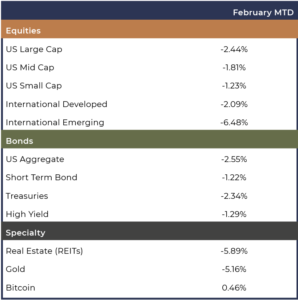
Index definitions: “U.S. Large Cap” represented by the S&P 500 Index. “U.S. Small Cap” represented by the S&P 600 Index. “International” represented by the MSCI Europe, Australasia, Far East (EAFE) Net Return Index. “Emerging” represented by the MSCI Emerging Markets Net Return Index. “U.S. Aggregate” represented by the Bloomberg U.S. Aggregate Bond Index. “Treasuries” represented by the Bloomberg U.S. Treasury Bond Index. “Short Term Bond” represented by the Bloomberg 1-5 year gov/credit Index. “U.S. High Yield” represented by the Bloomberg U.S. Corporate High Yield Index. “Real Estate” represented by the Dow Jones REIT Index. “Gold” represented by the LBMA Gold Price Index. “Bitcoin” represented by the Bitcoin Galaxy Index.
3550 Lenox Rd NE
Suite 2550
Atlanta, Georgia 30326
Investment Advisory services are provided through Bison Wealth, LLC located at 3550 Lenox Road NE Suite 2550 Atlanta, GA 30326. Securities are offered through Metric Financial, LLC. located at 725 Ponce de Leon Ave. NE Atlanta, GA 30306, member FINRA/SIPC. Bison Wealth is not affiliated with Metric Financial, LLC. Bison Wealth is an independent investment adviser registered under the Investment Advisers Act of 1940, as amended. Registration does not imply a certain level of skill or training. Check the background of this investment professional on FINRA’s BrokerCheck. Bison Wealth, LLC does not offer tax or legal advice.
Investment adviser representatives affiliated with Metric Financial, LLC, a FINRA member broker-dealer, will earn commissions on certain investments. This presents a conflict of interest because the representative is incentivized to earn a commission. This conflict is mitigated, however, because you are not required to engage the IAR or Metric Financial, LLC to invest in securities. To the extent your IAR is affiliated with a broker-dealer, you may request copies of the Form CRS associated with the broker-dealer to better understand fees and services and how those fees and services differ from those provided by Bison Wealth, LLC. Any fees and/or commissions billed by Metric Financial, LLC are distinct from and in addition to fees billed by Bison Wealth, LLC.
Bison Wealth Form CRS | Form ADV Part 2 | Privacy Policy | Accessibility Statement