
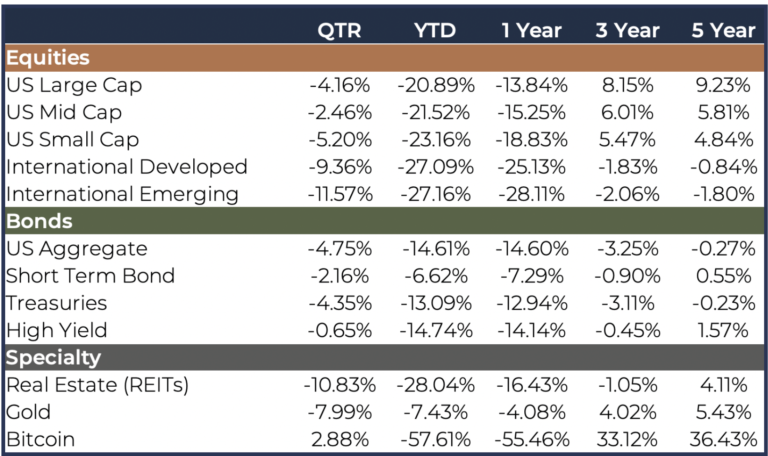
Since mid-year, not much has changed from beginning to end. We reside in the same position with the same outlook and expectations, and nearly the same market levels that we had in mid-June. However, in between the beginning and the end of the quarter, we witnessed a 15% rally in the S&P 500 from the June lows that was fueled by hope the FED would be able to engineer a soft landing for the economy, while bringing down the rate of inflation.
The August inflation report delivered a sobering blow to the financial markets, affirming the reality that inflation would be stickier than many expected. Subsequent to this report, when the Fed announced the latest 0.75% rate increase, Chairman Powell delivered a more direct version of the message that he has been delivering for months, that the Fed’s number one priority was tackling the inflation problem, even at the cost of some potential economic hardship. This reality sent the markets on their downward trend into the end of the quarter.
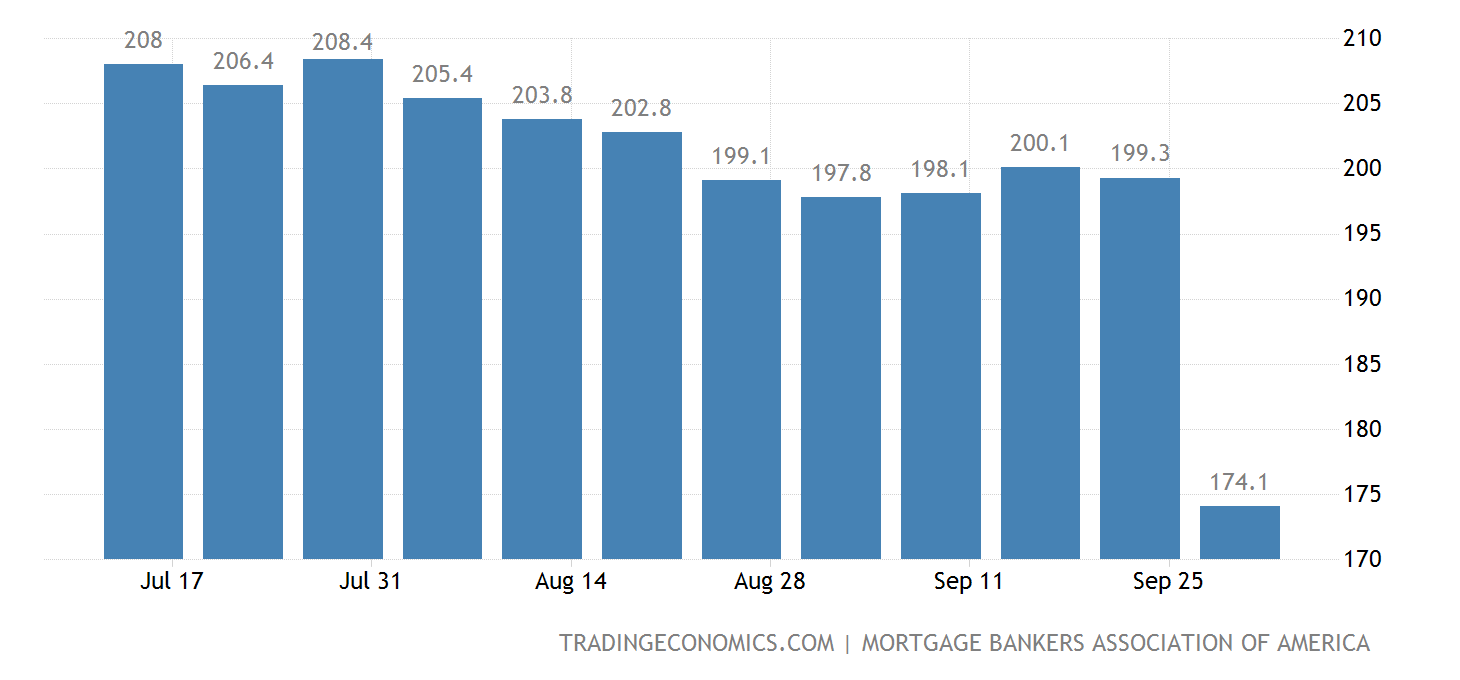
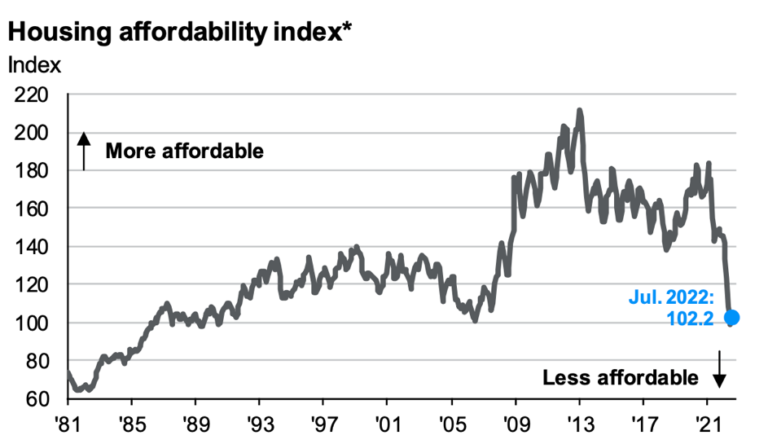
Our outlook for the economy and corporate earnings continues to remain guarded in terms of slowing growth and the rising risk of a decline in corporate earnings expectations. We have seen additional evidence that has reaffirmed this same outlook for slowing growth over the next several quarters. With respect to the economy, the consumer is clearly pulling back on purchases across the board and the “wealth effect” is beginning to have an impact on the higher end consumer, as retail inventories are mounting. Used car prices, which had been rising precipitously through the early part of this year, have rolled over as new car inventories are building. In addition, rising mortgage rates have resulted in a significant slowing of “Mortgage Purchase Applications” and sales of single family homes, which is certainly not helped by the new lows we are witnessing in housing affordability.
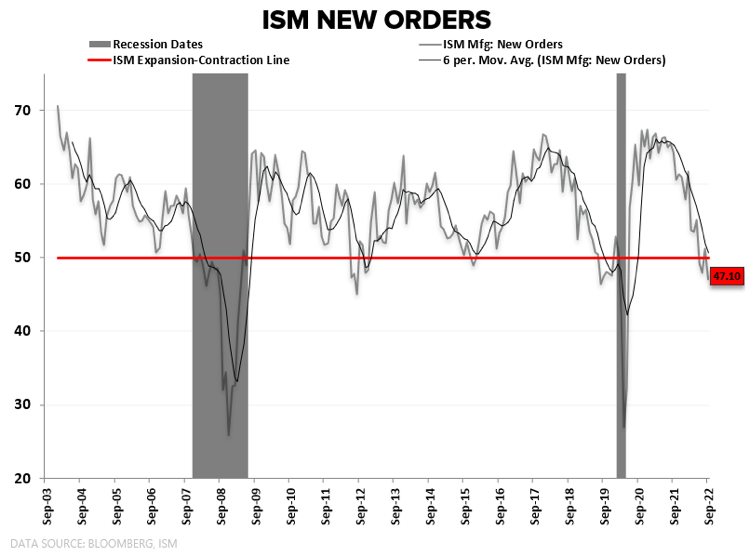
With respect to other manufacturing data, Industrial Supply Manufacturing Index (ISM) fell -1.9 pts to a 29-month low at 50.9 and continues to flirt with sub-50 level that signifies a contracting economic environment. ISM New Orders (shown below), Employment & Export Orders all fell into contractionary territory. The read-through into this data is that the remaining demand-supply imbalance is resolving itself predominately via demand destruction from a weakening consumer.
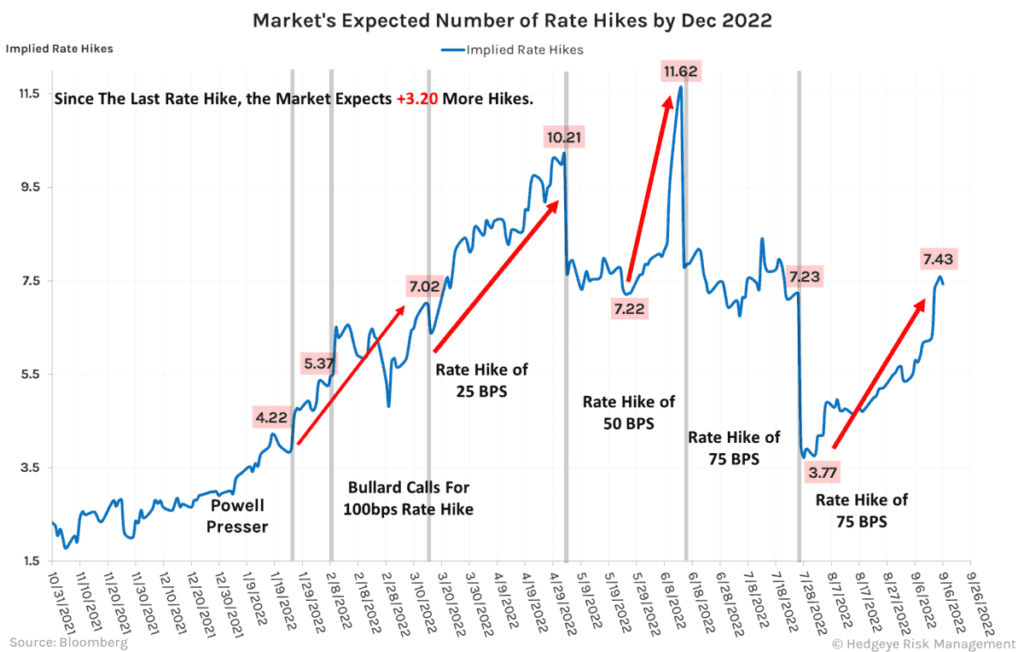
With respect to FED policy, market expectations for future rate hikes had taken a step downward in the July to August timeframe, however, those expectations for future increases have ticked back up. The market now is pricing in a total of 7.43 rate hikes for 2022.
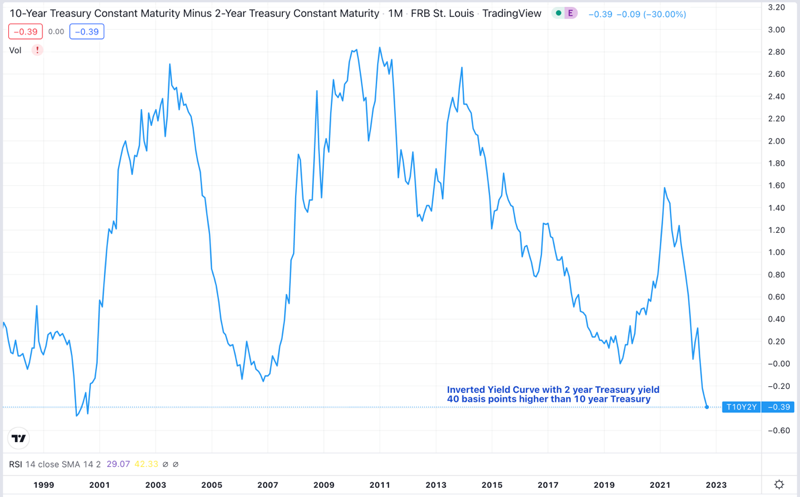
This same FED policy has resulted in what is called an inverted yield curve, where short-term interest rates are higher than long-term interest rates. At quarter’s end, the yield on 2-year treasury bonds was 4.28% compared to the yield on 10-year treasuries at 3.83%. The chart below shows the difference between the two going back 20+ years and that we are at levels comparable to the year 2000. The significance of an inverted yield curve, where shorter-term rates are higher than longer-term rates, is that the market is anticipating that the increase in short-term interest rates, prompted by the FED, will result in slowing economic growth and moderating inflation.
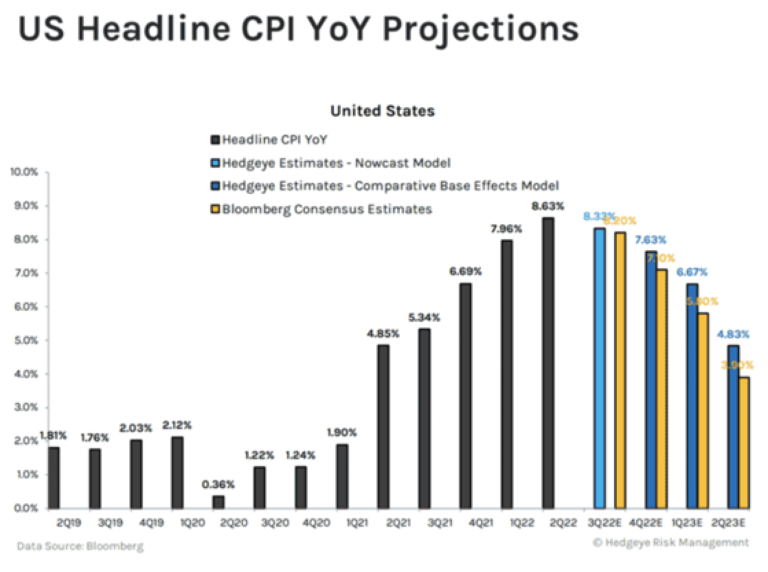
As noted above, the reasoning behind the current FED policy position is a function of the potential persistence of inflation at higher levels for longer. Taking a look at the intermediate outlook for inflation through the lens of its various components, shelter (housing) inflation continues to rise as shelter’s CPI contributions are up to 2.02% as of August, up from just 0.92% a year earlier. Meanwhile, Energy, Shipping, Used Car, Food-at-Home and other Commodity prices are rolling over. This paints the FED into a corner that will likely force the FED to remain “hawkish” for longer until we begin to see stronger signs of disinflation.
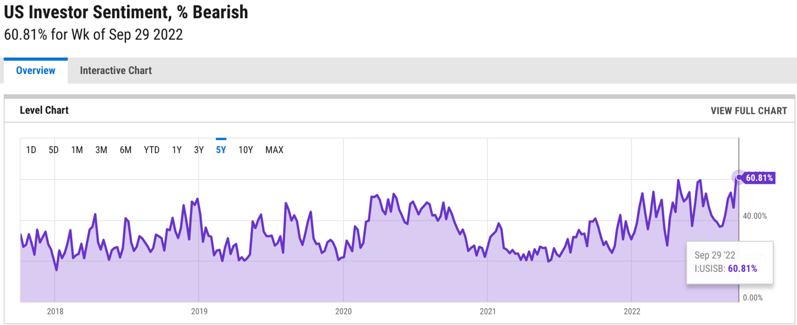
Is there a bright side to the story? Currently, we remain mired in a whirlwind of negative news and information flow with very little positive data to hang our hat on. This is why we keep our eye on data that measures investor sentiment and consumer confidence readings. Below is a chart showing the level of bearish sentiment for US stock market investors. The current reading shows that investors are exhibiting a high level of bearishness, indicating that the market could be oversold in the short-term.
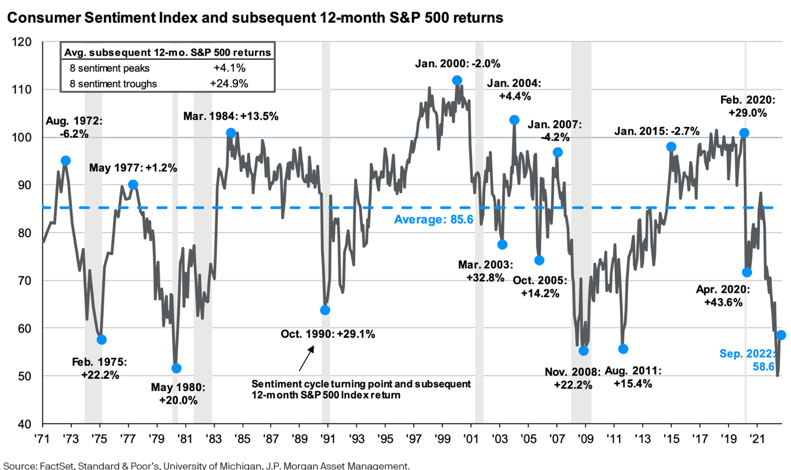
By the same token, consumer sentiment is certainly in the doldrums and resides at levels that have been seen at significant market bottoms. At prior troughs in consumer sentiment levels, the S&P 500 has registered average gains of 25% over the next 12 months.
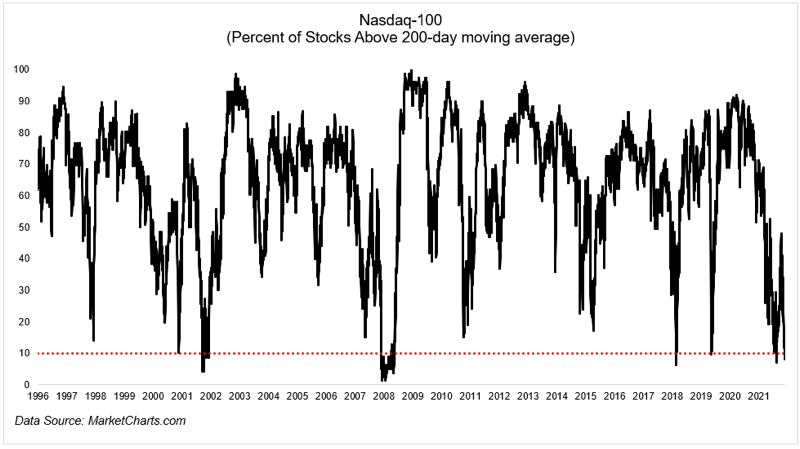
One other interesting piece of positive data related to investor sentiment is the percentage of stocks in the Nasdaq 100 Index that are trading below the 200-day moving average, also reflecting the current oversold condition of the market. Using extremes in a bear market as a contrarian buy indicator is unreliable in the short term. What looks like a washout might look placid compared to the potential typhoon behind it. But, if you can hang on to the wave, you will likely be rewarded in due time. Going back to 1996, when less than 10% of Nasdaq stocks are above their 200-day moving average, there has never been a negative return one year later. The average return one year later was 35%!
It is important to remember that bear markets associated with recessions tend to last longer than other bear markets. The average bear market dating back 90+ years has an average duration of 18 – 20 months, with an average decline of 28%. Only time will tell if this time around will play out like the averages, or if it will be better or worse. However, looking back at bear markets from the past, investors that had the fortitude and patience to stick to a disciplined investment approach, sacrificing the short-term pain for the long-term gain, came out on the other end reaping the rewards of that patience with a bottoming and new uptrend in equity prices.
This is why we focus on wealth and financial planning and build our portfolios based upon client objectives. As always, we believe that the best investment results are achieved by taking a long-term focus. We develop risk-managed investment plans that can weather the difficult times and thrive during the upswings. The greatest long-term investors like Warren Buffet and Sir John Templeton never tried to time the market. That being said, our team is constantly measuring and mapping the financial markets data to incorporate changes that can improve the portfolio’s performance in both the good and challenging times. Maintaining discipline, patience, and an objective investment approach is the best way to meet the long-term objectives of our clients.
Investment Advisory services are provided through Bison Wealth, LLC located at 1201 Peachtree St. Ste 1950 Atlanta, GA 30361. Securities are offered through Metric Financial, LLC. located at 725 Ponce de Leon Ave. NE Atlanta, GA 30306, member FINRA and SIPC. Bison Wealth is not affiliated with Metric Financial, LLC., More information about the firm and its fees can be found in its Form ADV Part 2, which is available upon request by calling 404-841-2224. Bison Wealth is an independent investment adviser registered under the Investment Advisers Act of 1940, as amended. Registration does not imply a certain level of skill or training.
The statements contained herein are based upon the opinions of Bison Wealth, LLC (Bison) and the data available at the time of publication and are subject to change at any time without notice. This communication does not constitute investment advice and is for informational purposes only, is not intended to meet the objectives or suitability requirements of any specific individual or account, and does not provide a guarantee that the investment objective of any model will be met. An investor should assess his/ her own investment needs based on his/her own financial circumstances and investment objectives. Neither the information nor any opinions expressed herein should be construed as a solicitation or a recommendation by Bison or its affiliates to buy or sell any securities or investments or hire any specific manager. Bison prepared this Update utilizing information from a variety of sources that it believes to be reliable. It is important to remember that there are risks inherent in any investment and that there is no assurance that any investment, asset class, style or index will provide positive performance over time. Diversification and strategic asset allocation do not guarantee a profit or protect against a loss in a declining markets. Past performance is not a guarantee of future results. All investments are subject to risk, including the loss of principal.
Index definitions: “U.S. Large Cap” represented by the S&P 500 Index. “U.S. Small Cap” represented by the S&P 600 Index. “International” represented by the MSCI Europe, Australasia, Far East (EAFE) Net Return Index. “Emerging” represented by the MSCI Emerging Markets Net Return Index. “U.S. Aggregate” represented by the Bloomberg U.S. Aggregate Bond Index. “Treasuries” represented by the Bloomberg U.S. Treasury Bond Index. “Short Term Bond” represented by the Bloomberg 1-5 year gov/credit Index. “U.S. High Yield” represented by the Bloomberg U.S. Corporate High Yield Index. “Real Estate” represented by the Dow Jones REIT Index. “Gold” represented by the LBMA Gold Price Index. “Bitcoin” represented by the Bitcoin Galaxy Index.
3550 Lenox Rd NE
Suite 2550
Atlanta, Georgia 30326
Investment Advisory services are provided through Bison Wealth, LLC located at 3550 Lenox Road NE Suite 2550 Atlanta, GA 30326. Securities are offered through Metric Financial, LLC. located at 725 Ponce de Leon Ave. NE Atlanta, GA 30306, member FINRA/SIPC. Bison Wealth is not affiliated with Metric Financial, LLC. Bison Wealth is an independent investment adviser registered under the Investment Advisers Act of 1940, as amended. Registration does not imply a certain level of skill or training. Check the background of this investment professional on FINRA’s BrokerCheck. Bison Wealth, LLC does not offer tax or legal advice.
Investment adviser representatives affiliated with Metric Financial, LLC, a FINRA member broker-dealer, will earn commissions on certain investments. This presents a conflict of interest because the representative is incentivized to earn a commission. This conflict is mitigated, however, because you are not required to engage the IAR or Metric Financial, LLC to invest in securities. To the extent your IAR is affiliated with a broker-dealer, you may request copies of the Form CRS associated with the broker-dealer to better understand fees and services and how those fees and services differ from those provided by Bison Wealth, LLC. Any fees and/or commissions billed by Metric Financial, LLC are distinct from and in addition to fees billed by Bison Wealth, LLC.
Bison Wealth Form CRS | Form ADV Part 2 | Privacy Policy | Accessibility Statement